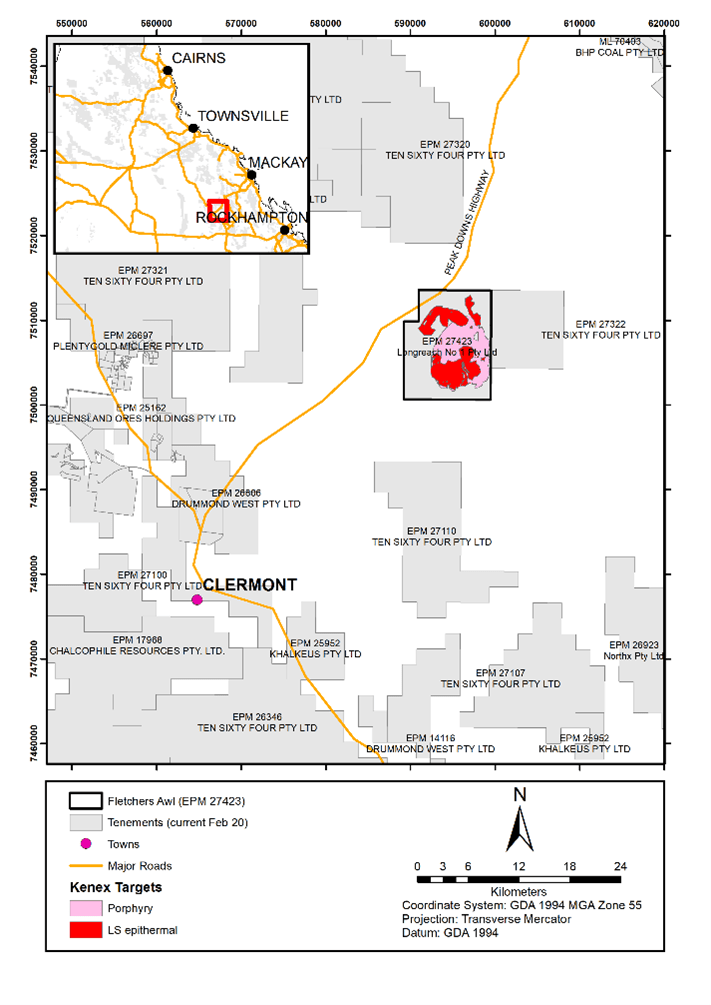
Longreach Mineral Exploration’s Fletchers Awl Project
Kenex have been working with our strategic partner Longreach Mineral Exploration to explore their Fletchers Awl copper-gold project in Central Queensland. The project focusses on an area that saw historic copper, silver, and gold mining and has the potential to host significant porphyry and epithermal mineralisation.
Kenex have been involved at all stages of exploration from initial targeting and permitting through to the collation of historic exploration data and 2D and 3D geology mapping. This work has generated a practical mineral system model that can be used during exploration to improve targeting success.
The Fletchers Awl Project is located 35 km northeast of Clermont in Central Queensland, within the Drummond Basin. The area contains several historic workings in intermediate volcanics, within a domal basement inlier. Away from this inlier, the surrounding area is covered by thin Tertiary volcanics, obscuring the Paeleozoic geology beneath. The centre of the inlier is cored by an Ordovician S-type granite that is unrelated to the mineralisation. A small diorite intrusion occurs in the southeast corner that has received little historic attention but could represent a source of metals, fluid, and energy for the mineral system.
Data Compilation and Project Review
Kenex undertook a detailed historic data compilation over the project area. All relevant data were sourced from exploration reports, Government websites, and Kenex’s proprietary databases. These data were cleaned and combined into a well-structured exploration GIS to allow the critical layers to be plotted and compared. Kenex used these data to perform a technical review of the project, detailing exploration history, geology, and prospectivity, and providing recommendation on exploration going forward.
2D Geology Mapping
In early 2021, Longreach flew a detailed magnetic-radiometric survey over the project area with the goal of generating a basement geology map to guide targeting. The acquired data are high quality and represent a vast improvement on Government data available over the area.
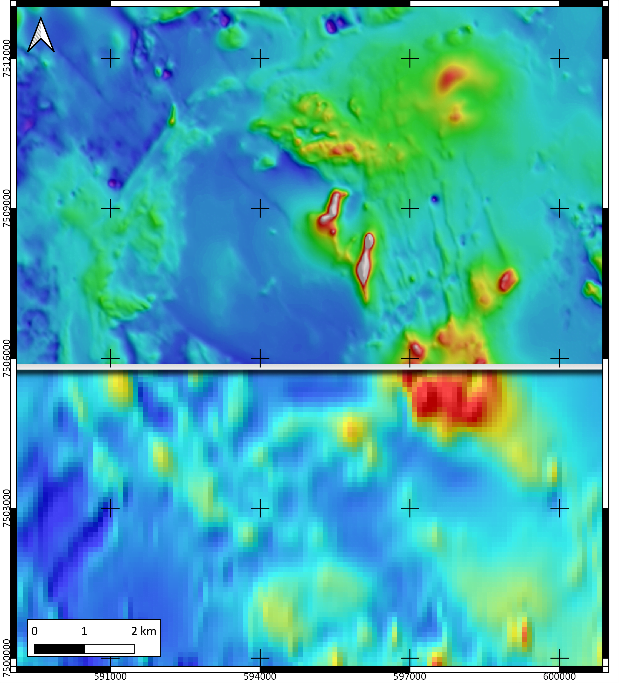
Kenex used several machine learning methods to generate geology maps from the geophysical data. These methods are fast and unbiased and can be iterated to produce the most geological reasonable result. The maps generated by the algorithms closely matched the surface mapping conducted by the geological survey and extended this mapping under cover.
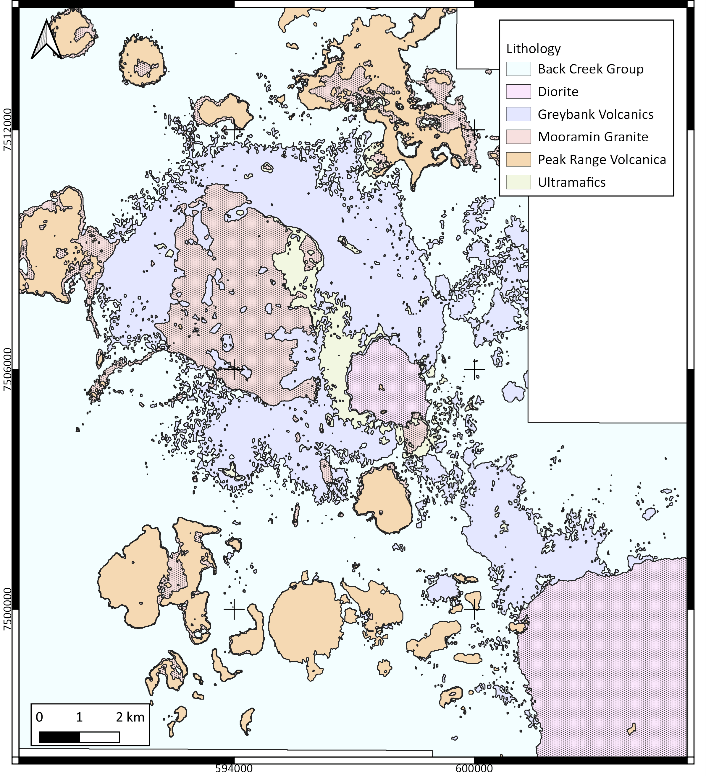
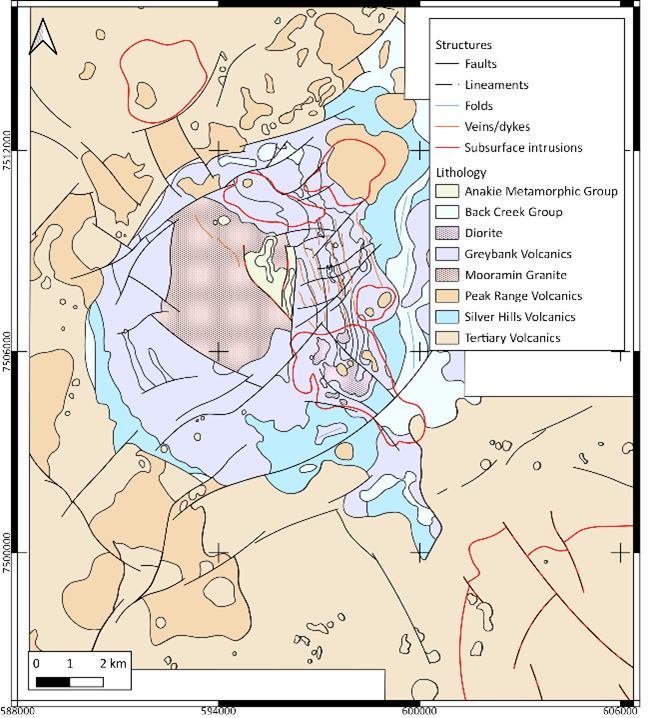
To add additional detail to the map, an expert interpreter then conducted a manual interpretation of the data, using the machine learning outputs as a guide. The result is a detailed geology and structure map that shows all the units relevant to the porphyry and epithermal mineralisation. The process of generating this map also involved researching the geological history of the area and a stratigraphic column and structural history were also produced.
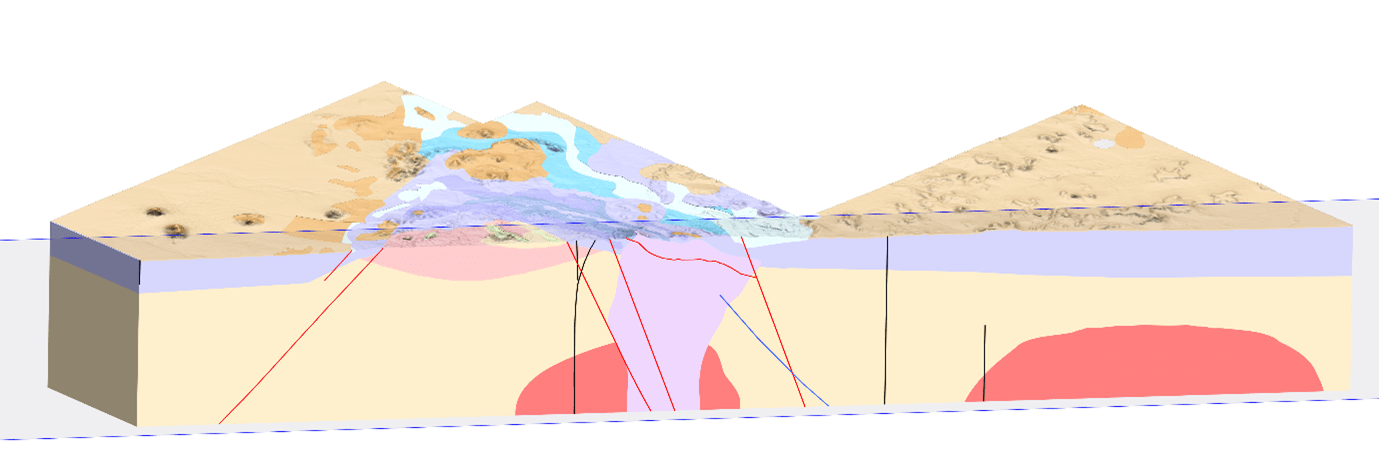
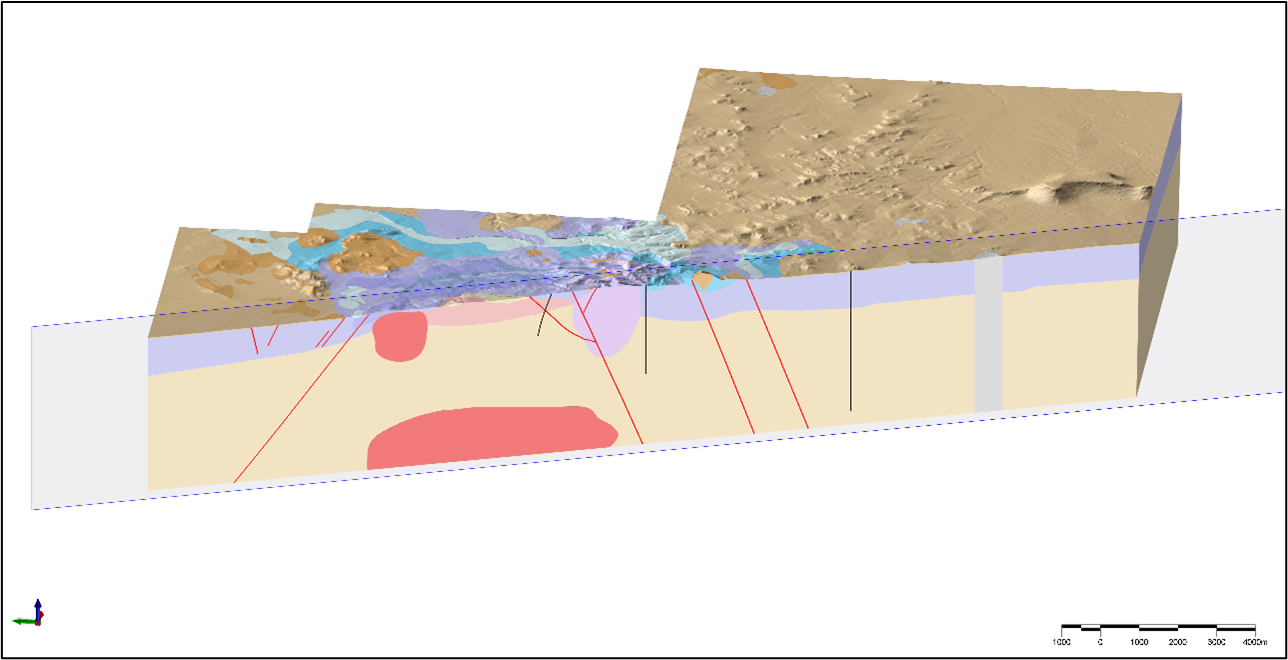
3D Geology Mapping
Kenex extended the geology map into three dimensions using wireframing and implicit modelling techniques. The 2D map was used alongside a 3D inversion of the magnetic data and numerous other datasets to construct wireframes representing each unit and structure. Drilling logs and geological reasoning were used to determine the geometry of the units at depth.
The resulting map allows critical predictors of mineralisation such as source rocks and faults to be viewed in 3D. Other data such as drilling and geophysics can be plotted onto the geology map to help understand controls on mineralisation. The 3D map is particularly useful for drill planning and can be updated to reflect new data or evolving knowledge of the geology.
Learn more about this project
Publications
Maximising the extraction of geological information from geophysical datasets using machine learning and 3D mapping